glibc keeps threaded Python's memory until you trim
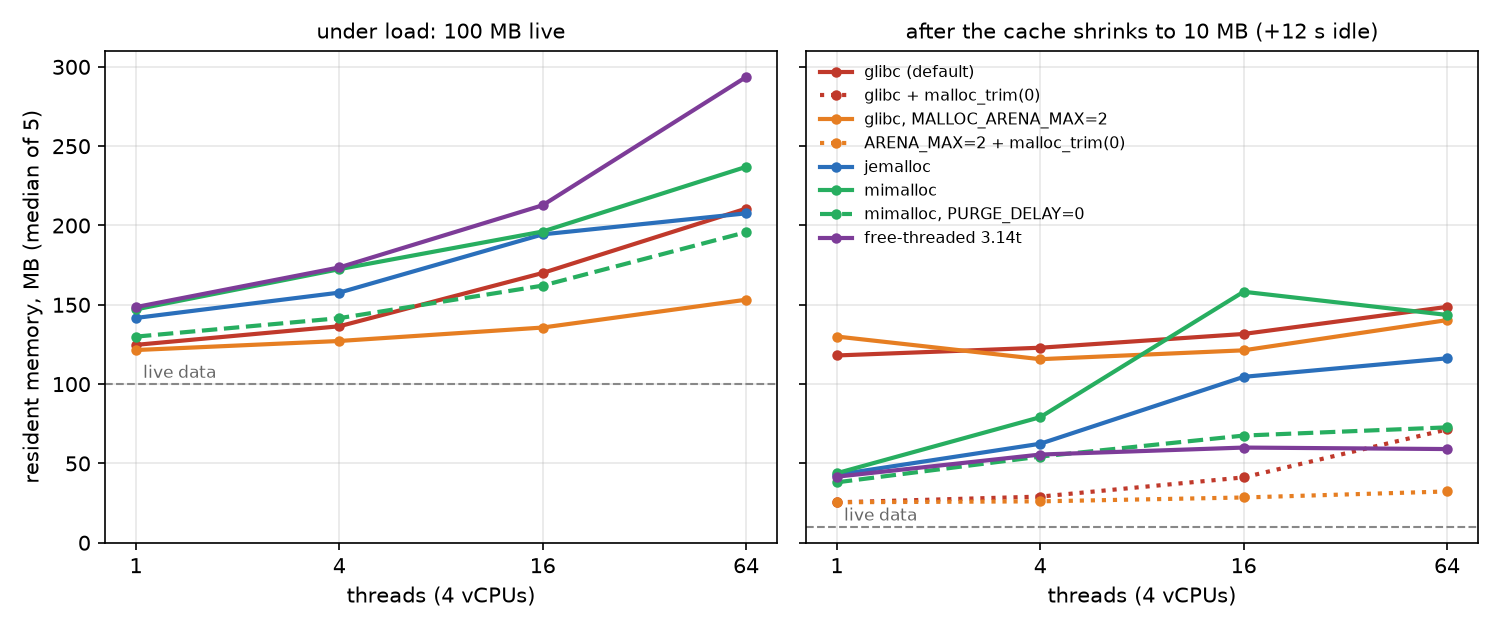
I ran a small fake web worker in Python 3.14 on Linux: threads serve requests, and some response bodies go into a shared cache. I filled the cache to 100 MB, cut it to 10 MB, and kept serving. With the default glibc allocator the process still held 118 MB with one thread and 149 MB with 64, and waiting didn't change that. One call to malloc_trim(0) brought it down to 25 MB and 71 MB. Setting MALLOC_ARENA_MAX=2 plus the trim got 64 threads down to 32 MB. Swapping in jemalloc or mimalloc returned memory without being asked, but only with a few threads. And the free-threaded build, which has its own allocator for Python objects, gave memory back after an idle pause but used the most memory while busy.
The setup
Each request makes a random body (lognormal sizes, median about 4 KB, capped at 1 MB), round-trips a 200-item dict through json, and with probability 0.3 stores the body in a shared LRU cache. The first phase serves 96,000 requests with the cache capped at 100 MB, so it fills and churns. Then the cache is trimmed to 10 MB and the same number of threads serves half as many requests again. Total work is the same at every thread count. I read resident memory from /proc/self/status after each phase (after gc.collect()), again after 12 seconds of doing nothing, and, for glibc, after malloc_trim(0).
In the regular build, Python's own allocator handles objects of 512 bytes or less and passes everything bigger to malloc, so most of the body bytes here go through the C allocator. Swapping that allocator is one environment variable: LD_PRELOAD pointing at jemalloc 5.3.0 or mimalloc 3.0.1, against glibc 2.41. The free-threaded build (3.14t) routes Python objects through its own bundled mimalloc instead.
Results
Resident MB, median of 5 runs. The interpreter alone starts at 14 MB with glibc and 18 to 25 MB with the others, so a perfect allocator would end near 25 to 35 MB after the shrink.
| allocator | threads | under load (100 MB live) | after shrink + 12 s idle (10 MB live) | + malloc_trim(0) |
|---|---|---|---|---|
| glibc | 1 | 125 | 118 | 25 |
| glibc | 64 | 211 | 149 | 71 |
| glibc, MALLOC_ARENA_MAX=2 | 64 | 153 | 140 | 32 |
| jemalloc | 1 | 142 | 43 | |
| jemalloc | 64 | 208 | 116 | |
| mimalloc | 1 | 147 | 44 | |
| mimalloc | 64 | 237 | 144 | |
| mimalloc, MIMALLOC_PURGE_DELAY=0 | 64 | 196 | 73 | |
| free-threaded 3.14t | 1 | 149 | 42 | 44 |
| free-threaded 3.14t | 64 | 294 | 59 | 61 |
A few things stood out.
glibc never gives the memory back on its own. The figure 12 seconds after the last request was within 4 KB of the one right after it in every glibc run. free() only returns memory at the very top of the heap, and the trim call is the thing that releases free pages from the middle. It is a known fix (people on discuss.python.org call it after bursts of work), and here it was worth 93 MB of the 118 at one thread.
More threads means more held memory, for every allocator. glibc gives threads their own arenas (up to eight per core by default), and each one keeps its own free space. Capping that with MALLOC_ARENA_MAX=2, the setting Heroku recommends, made it the leanest setup under load at 64 threads: 153 MB against 211. jemalloc and mimalloc keep per-thread caches too, and at 16 to 64 threads they held 105 to 158 MB after the shrink instead of about 43.
The obvious jemalloc knob made it worse. Turning on jemalloc's background purging thread (MALLOC_CONF=background_thread:true) raised memory under load at 64 threads from 208 to 256 MB, and after the idle wait it still held 111. Telling mimalloc to purge immediately (MIMALLOC_PURGE_DELAY=0) was the best drop-in: 196 MB under load and 73 MB after, at 64 threads.
Free-threaded Python holds more while busy and gives it back when idle. With real parallelism the first phase ran 3 to 4 times faster on 4 cores, but memory under load reached 294 MB at 64 threads (one run hit 380 MB at peak). Right after the shrink it still held 128 MB at one thread. After 12 idle seconds it was down to 42 to 60 MB at every thread count, without any call. Preloading jemalloc or mimalloc into 3.14t changed little, since Python objects there don't go through malloc.
Throughput didn't separate the allocators in the regular build: the first phase took 18 to 20 seconds for every setup, which is the GIL's limit, not the allocator's. I didn't time malloc_trim itself. It locks each arena while it works (the Cloudflare post on RocksDB and tcmalloc notes that cost), so calling it after a burst is better than calling it per request.
What I'd do
For a threaded Python service on glibc whose memory never comes down after a busy spell: set MALLOC_ARENA_MAX=2 and call ctypes.CDLL("libc.so.6").malloc_trim(0) after a burst or on a timer. That pair ended at 26 to 32 MB after the shrink at every thread count, the lowest of any setup from 4 threads up. If you'd rather not touch code, preload mimalloc with MIMALLOC_PURGE_DELAY=0.
Method: Linux 6.18 (aarch64) VMs with 4 vCPUs and 2 GB, one fresh VM per run, four runs at a time; Debian 13, CPython 3.14.8 and 3.14.8 free-threaded. 5 runs per setting, 300 runs in total over three sweeps; thread counts 1, 4, 16 and 64. The table gives medians; mimalloc at 16 and 64 threads varied most between runs (114 to 270 MB after the shrink at 64). This is one synthetic workload with one size distribution, run for under a minute; a real service with different object sizes or hours of uptime could land elsewhere.