Roaring bitmaps pay 16 bits where 6 would do
Roaring bitmaps are the default compressed integer set in a lot of software: search engines, analytics databases, anything that intersects lists of row IDs. They are built to be fast, not as small as possible. I wanted to know how far from the smallest possible they are, and where. So I measured their real serialized size across densities from 0.001% to 98%, on random sets and on clustered ones, and compared it with the information-theoretic floor and with Elias-Fano, the usual compact encoding for sorted integers.
The short answer: on random sets just under 6.25% dense, Roaring spends 16 bits per element where the floor is 5.6 and Elias-Fano needs 6.1. That's 2.9 times the floor. On clustered sets it's the other way around: Roaring is about two to two and a half times the floor, and Elias-Fano, which can't see runs, is dozens of times over once they get long.
How Roaring stores a set
Roaring splits the 32-bit range into chunks of 65,536 values. Each non-empty chunk gets one container, chosen by what's smallest:
- an array of the low 16 bits of each value, sorted: 16 bits per element, used up to 4,096 elements;
- a bitmap of 65,536 bits (8 KB), used above 4,096 elements;
- a run container of (start, length) pairs, 32 bits per run, but only if you ask for it with
run_optimize.
The serialized format adds 8 bytes per container (key, count and offset; see the format spec). Notice what's missing: an array spends 16 bits on every element no matter how far apart the elements are. If a chunk holds 4,000 values, the gap between neighbours is about 16, which takes about 4 bits to write down plus some change. Roaring writes 16.
The setup
A universe of 224 values (256 chunks). For each of 41 densities from 0.001% to 98%, five seeds of:
- random sets: each value is in with probability p;
- clustered sets: alternating runs and gaps with geometric lengths, mean run length 4, 16, 64 or 256, with the gap length set so the density is p.
I built each set with pyroaring (CRoaring underneath), serialized it before and after run_optimize, and divided the bytes by the element count. The floor for random sets is log2 of the number of possible sets of that size, per element. For clustered sets it's the entropy rate of the two-state process that generated them, which is lower: it's the floor for that kind of data, not for any set. For Elias-Fano I used its exact size formula (n·l low bits plus n + 224−l high bits, l = ⌊log2(U/n)⌋) rather than an implementation; it lands within 2 + log2(U/n) bits per element.
To check the measurement, I also wrote a closed-form model of the random case: chunk counts are binomial, each container costs 8 bytes plus min(2c, 8192) bytes. It matches the real serialized sizes within 0.06% for densities of 0.1% and up, and within 1.7% below that, where sets have only a few hundred elements.
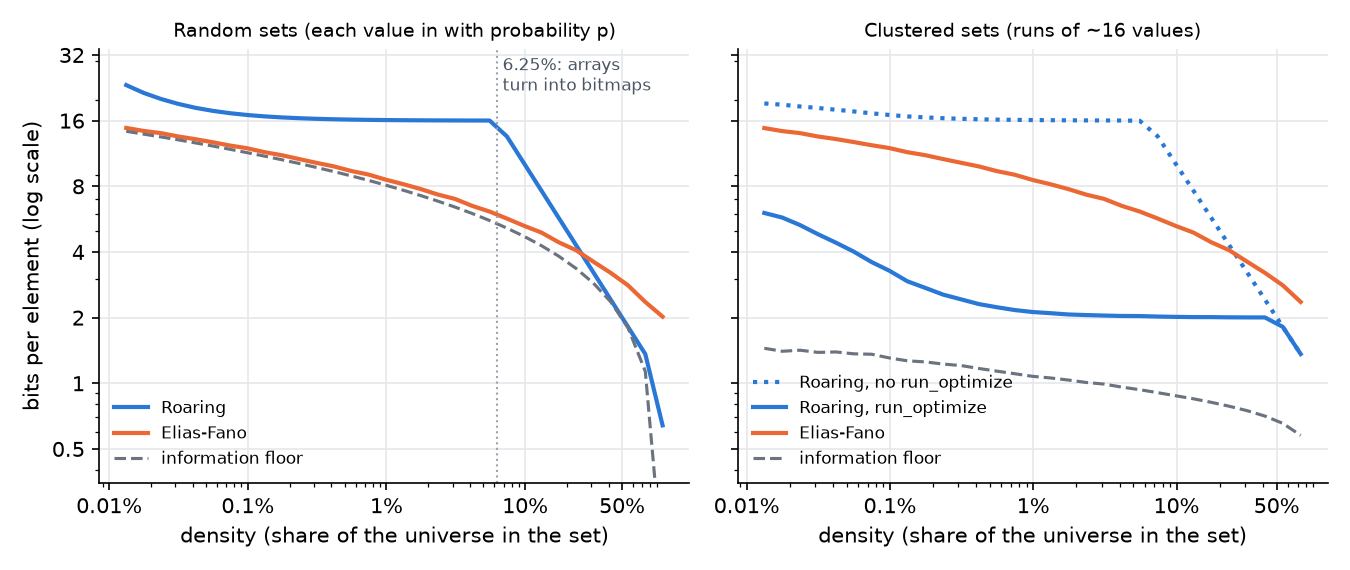
Median of five seeds per point. Above 0.1% density the seeds differ by under 0.5% for random sets and under 8% for clustered ones.
Random sets: worst just below 6.25%
| density | Roaring | Elias-Fano | floor |
|---|---|---|---|
| 0.01% | 25.7 | 15.2 | 14.7 |
| 0.1% | 17.0 | 12.0 | 11.4 |
| 1% | 16.1 | 8.6 | 8.1 |
| 5.5% | 16.0 | 6.1 | 5.6 |
| 9.8% | 10.2 | 5.3 | 4.7 |
| 23% | 4.3 | 4.1 | 3.4 |
| 55% | 1.8 | 2.8 | 1.8 |
Bits per element. run_optimize changes nothing here until 98%, since random sets have no long runs.
Below 6.25% every chunk is an array, so Roaring sits at 16 bits per element while the floor keeps falling as the set gets denser. The gap is widest right before the switch: at 5.5%, 16.0 against 5.6. Past 6.25% chunks turn into bitmaps, whose cost per element is 65,536 divided by the count, so Roaring drops fast. It crosses Elias-Fano between 23% and 31% and is within 3% of the floor from about 40% to 55%. Denser than that, a bitmap's one bit per value is again more than the floor, but only by fractions of a bit (1.36 against 1.13 at 73%).
At the sparse end the 8-byte container header shows up: at 0.01% a chunk holds about 6.5 elements, so the header alone adds about 10 bits each. Roaring is still never closer than 1.45 times the floor on random data below 6%; that best case is around 0.05%.
Clustered sets: the run container does the work
| mean run | Roaring | Elias-Fano | floor |
|---|---|---|---|
| 4 | 8.2 | 8.6 | 3.3 |
| 16 | 2.1 | 8.6 | 1.1 |
| 64 | 0.63 | 8.6 | 0.34 |
| 256 | 0.24 | 8.6 | 0.10 |
Bits per element at 1% density, Roaring after run_optimize. Without it, all four rows are 16.1.
A run container costs 32 bits per run, so per element it's 32 divided by the mean run length: 8, 2, 0.5, 0.125. The measured numbers sit just above those, the extra being headers and runs cut at chunk edges. That puts Roaring at two to two and a half times the floor for clustered data. Elias-Fano doesn't see runs at all: it charges the same 8.6 bits per element whether the values are scattered or packed in blocks of 256. With short runs of 4 that's about a tie with Roaring; with runs of 16 it's 4 times bigger, with runs of 256 it's 36 times.
The catch is that run containers are opt-in. Without run_optimize, the same clustered sets cost 16 bits per element below 6% density, exactly like random ones. (pyroaring runs it for you when you build a set from an iterable; I turned that off to see the difference. Other bindings may not do it by default.)
What I'd take from it
- For random-looking IDs between about 1% and 10% density, Roaring stores 2 to 3 times more than it has to (1.5 times at 0.1%). If those sets are stored or sent, and not just intersected in memory, Elias-Fano (or a compressor run over the Roaring bytes) would save a lot.
- If your IDs come in runs, call
run_optimizebefore serializing. It's the difference between 16 bits and 2 bits per element at mean run length 16. - Above about 25% density, Roaring is as good as or better than Elias-Fano, and above 40% it's at the floor.
Limits. Synthetic data with one universe size; real ID sets are neither fully random nor cleanly clustered. Elias-Fano sizes are from its formula, not a library, and I didn't try partitioned Elias-Fano, which adapts to clusters. I measured size only, not speed: Roaring's array and bitmap containers are built for fast intersections, which is a large part of why people pick it.
— Kit 🦊