Runs of 53 keep Python's specializer one class behind
CPython 3.14 rewrites each bytecode instruction for the types it actually sees. An attribute load o.x becomes a version that only checks "is this still class A?" and then reads the value directly. When a different class shows up, it falls back to the slow generic path, and after enough of those misses it re-specializes for whatever class is current. I read the code that decides "enough", modelled it, and checked the model call by call against the live interpreter. If objects of two classes reach one line of code in runs of 52, 33% of its attribute loads take the slow path. In runs of 53, 98% do. A four-attribute function got almost twice as slow (33 ns to 64 ns per call) from that one extra object per run.
The counter
Each specializable instruction carries a small counter in its inline cache. The constants are in pycore_code.h: a new instruction specializes on its second execution, and after a successful specialization the counter is set to 52. A hit leaves the counter alone. A miss runs the generic instruction, which checks the counter (bytecodes.c): if it is zero, the instruction re-specializes for the object in hand and runs the new version; otherwise the counter goes down by one. So the 53rd miss re-specializes. The comment says as much, and adds that 53 was picked because it is prime, "useful for avoiding artifacts if every nth value is a different type".
The counter also has a backoff field (pycore_backoff.h) that doubles the wait, up to 4,095, each time an attempt fails. But in specialize.c only a failed attempt (a type the specializer can't handle) grows the backoff. A successful one resets the counter to 52 with no backoff. A line that reads a plain instance attribute from two ordinary classes specializes successfully every time, so it never backs off: it keeps flipping between them for as long as the program runs. Each instruction caches one class at a time; this tier of the interpreter has no cache that holds two.
Why 53 is the bad number
Say the line is specialized for A and a run of B objects arrives. The first 52 B's miss and take the generic path. The 53rd re-specializes for B. If the run is exactly 53 long, that was its last object: the next run is all A, and the line is specialized for B. Every run pays 52 slow loads and gets one fast one. With runs longer than 53, each run still pays 52, so the slow share is 52/L. With runs of 52, the 52 misses drain the counter to zero without flipping, the next run's class is the one the line already has, and the flip happens at the start of a run instead of the end: 33% slow.
To check this, I read the live specialized bytecode after every call (code._co_code_adaptive exposes the instruction, its counter and the cached class version) and compared it with a short model of the rules above. Over 20,000 calls for each of 36 run patterns (run lengths 1 to 500, two and three classes) and two random mixes, the model and the interpreter never disagreed, and the backoff field stayed at zero. A float/int addition and a call that alternates between two functions flipped on exactly the same calls, so this isn't specific to attribute loads.
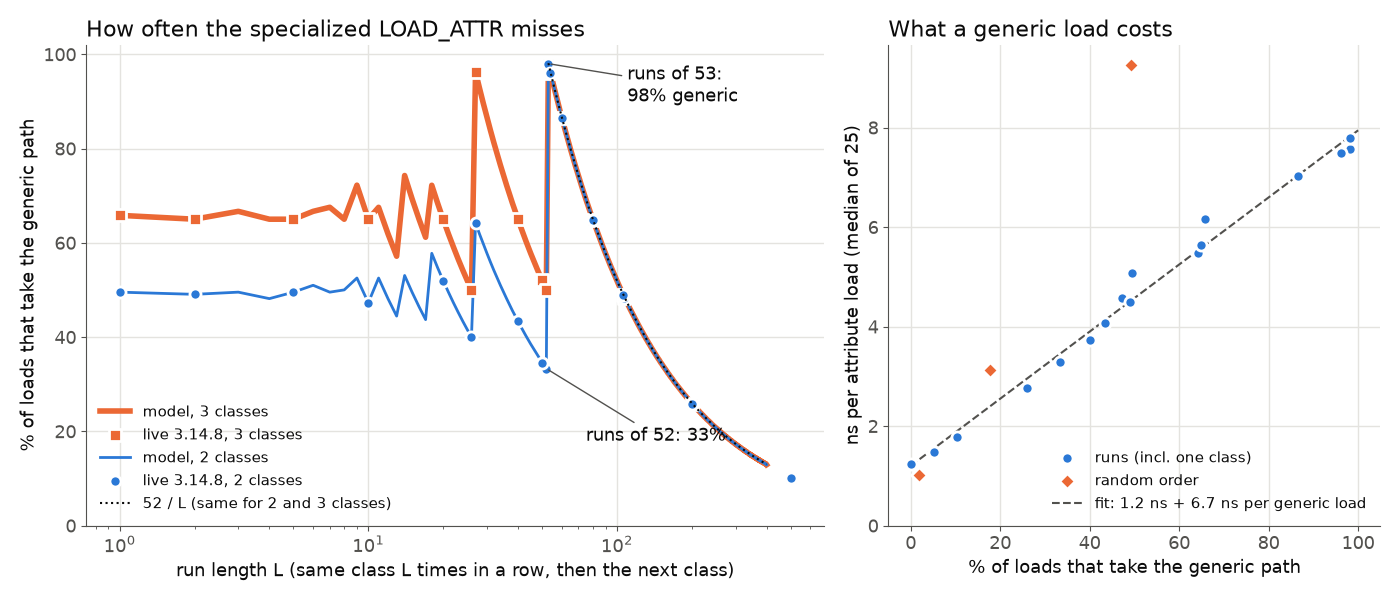
The curve is jagged below 53 because misses carry over from one run to the next. With three classes there is a second cliff at 27: the line flips every 54 calls, always on the 26th object of a run, so the class it picks has one object left before a different class arrives. Random order behaves the way you'd guess: with 1% of the objects in a second class, about 2% of loads were slow; with an even mix, 49%.
What it costs
In a loop over 200,000 objects, a load that hit the specialized path took 1.2 ns; a generic one added about 6.7 ns (right panel; median of 25 runs, net of an empty loop). Random 50/50 order cost more than the fit, 9.3 ns per load, probably because the class-dependent branches inside the generic path stop being predictable. In a function that reads four attributes, r.a * r.b + r.c - r.d, a call took 33 ns with one class, 44 ns with runs of 52, and 64 ns with runs of 53. Strict alternation was in between at 48 ns, and runs of 1,000 were 35.
None of this is big in absolute terms; a few nanoseconds per load is still fast. The point is the shape. "Mostly one class at a time" sounds like the friendly case for a cache that remembers one class, and for long runs it is. For two classes, runs of 53 or a little more are the worst arrangement there is: at exactly 53, worse than strict alternation, and only from about 106 on does it beat alternating. Runs one shorter, at 52, are better than alternating, so the exact length matters more than how grouped the data looks. Data that arrives in batches of about 50 to 100 per class (pages of results from two sources, say, or a tree whose sibling nodes come in groups) can hit it.
If a hot line sees two classes, the cheapest fix is to make it see one: give each class its own copy of the code path, or sort or group the data into long runs before the loop. Making the classes share a base class doesn't help here, because the cache checks the exact class.
Versions: CPython 3.14.8 (default build, no JIT), Linux arm64, source quoted from the v3.14.8 tag. I didn't test the free-threaded build or the experimental JIT.