The Rule Was the Strict Part
"100 requests per minute" sounds like one rule. There are four common ways to enforce it, and they disagree:
- Fixed window: a counter per calendar minute, reset at :00.
- Sliding log: keep the timestamp of every admitted request and allow a new one only if fewer than 100 fall in the last 60 seconds. This is the rule taken literally.
- Sliding-window counter: keep this minute's count and last minute's count, and estimate the last 60 seconds as this minute's count plus last minute's count weighted by how much of last minute is still inside the window. Cloudflare described it in 2017; it's cheap and popular.
- Token bucket: a bucket holding up to B tokens refills at 100 per minute, and each request takes one. GCRA, the version many Redis-based limiters use, is the same thing written in terms of a "theoretical arrival time".
I wanted to know how far apart they really are, against an attacker and against ordinary clients, so I simulated them. The answer I didn't expect was that the cheap approximations aren't the main problem. The rule is. Taken literally, "at most 100 in any 60 seconds" rejects 29% of the requests from a client that averages 80 a minute in bursts, and no limiter, even one that knows the future, can serve more of that client without letting some minute go over 100. Every algorithm that serves more is quietly enforcing a looser rule. Two smaller findings: the sliding-window counter is matched or beaten on both counts, in 19 of 20 cases, by a plain token bucket, and a sliding log that also records rejected requests can lock out a client using a quarter of its quota.
The setup
One key, a limit of 100 per 60 seconds, timestamps in microseconds. Every limiter sees exactly the same arrivals. For each admitted request I check the real rule against that limiter's own history: how many requests it admitted in the 60 seconds before. That gives the busiest real minute, and for each decision whether the literal rule would have agreed. Client traffic comes in five shapes, each run at 30%, 50%, 80% and 100% of the limit on average, 20 runs of 2,000 minutes each:
- steady: independent random arrivals (Poisson);
- small bursts: groups of about 5 requests within a second;
- page loads: groups of about 20 within a second;
- big bursts: groups of about 50 within two seconds;
- on/off: active periods with heavy-tailed lengths, busy 20% of the time.
Three checks before trusting it. The sliding log under steady traffic is a textbook queue in disguise: each admitted request holds one of 100 "slots" for exactly 60 seconds, which makes it an Erlang loss system, and the share served should be 1 minus Erlang's B formula. At 80%, 100% and 120% of the limit the simulation gave 99.61%, 92.41% and 80.35% against 99.60%, 92.43% and 80.37%. The fixed window should serve E[min(N, 100)] / E[N] with N Poisson; it gave 99.94%, 96.00% and 83.21% against 99.94%, 96.01% and 83.23%. And the token bucket and GCRA admitted exactly the same number of requests in all 400 runs where I ran both.
The first version of these checks failed by 4 to 5 standard errors. The cause was my random number generator, a 64-bit algorithm squeezed into 32-bit arithmetic. With a proper 32-bit one the gaps went away.
The attacker
An attacker who waits quietly and then floods gets, in the worst 60 seconds:
| Limiter | Worst 60 seconds | How |
|---|---|---|
| Sliding log | 100 | It's the rule. |
| Fixed window | 200 | 100 just before :00, 100 just after. |
| Sliding-window counter | 100 × (1 + φ), up to 200 | Flood starting a fraction φ into a minute. |
| Token bucket, burst B | B + 99 | Empty a full bucket, then take the refill. |
The sliding-window counter one is worth spelling out. Its estimate assumes last minute's requests were spread evenly. If they all came at the very end, the estimate fades them out while they're all still inside the window. Flood at 59 seconds past the minute: the counter admits 100 at once, then lets the new minute's count grow as last minute's weight fades, and just before the next 59-second mark there are nearly 200 in the window. Starting at 30 seconds the worst is 150. The simulation matched the formula at every one of 51 starting points.
The honest client
Here is the share of an honest client's requests served when it averages 80% of the limit, with the busiest real minute in brackets:
| Traffic at 80% | Sliding log | Fixed window | Sliding-window counter | Token bucket B=50 | Token bucket B=100 |
|---|---|---|---|---|---|
| steady | 99.6% (100) | 99.9% (116) | 99.8% (113) | 100% (118) | 100% (118) |
| small bursts | 88.9% (100) | 94.9% (175) | 91.4% (142) | 97.6% (149) | 99.7% (196) |
| page loads | 71.0% (100) | 81.6% (200) | 74.3% (173) | 77.3% (149) | 89.9% (199) |
| big bursts | 56.2% (100) | 66.3% (200) | 58.3% (186) | 54.2% (149) | 71.9% (199) |
| on/off | 63.0% (100) | 70.9% (200) | 65.4% (170) | 70.1% (149) | 77.8% (199) |
Mean of 20 runs of 2,000 minutes; standard errors at most 1.5 points. Busiest minute: the largest number admitted in any 60 seconds, averaged over runs.
The sliding log, the only limiter that never breaks the rule, is the strictest in every row but one (with big bursts the B = 50 bucket serves slightly less, 54.2% against 56.2%). For page loads at 80% it rejects 29% of the client's requests; even at 30% of the limit it rejects 9%. Bursts are the reason. At 80% that's four page loads a minute on average, and both the number per minute and the size of each vary a lot, so minutes over 100 are routine.
It isn't the log's fault. Admitting a request whenever the last 60 seconds have room is the best possible policy for this rule: no schedule, even one chosen with the whole future known, admits more. That's a classic result about choosing intervals of equal length, and I checked it by brute force on 3,000 small random cases (it was never beaten; a deliberately weakened version was beaten in 1,621). So every limiter that served more in the table did it by letting some minute go over 100, which the brackets show.
What about a token bucket set up so it can never break the rule? That needs burst plus one minute of refill to fit within 100, for example B = 40 refilling at 60 a minute. The best such bucket served 59.8% of the page-load client, against the log's 71.0%. Buckets that obey the rule pay for it twice, a small burst and a slower refill.
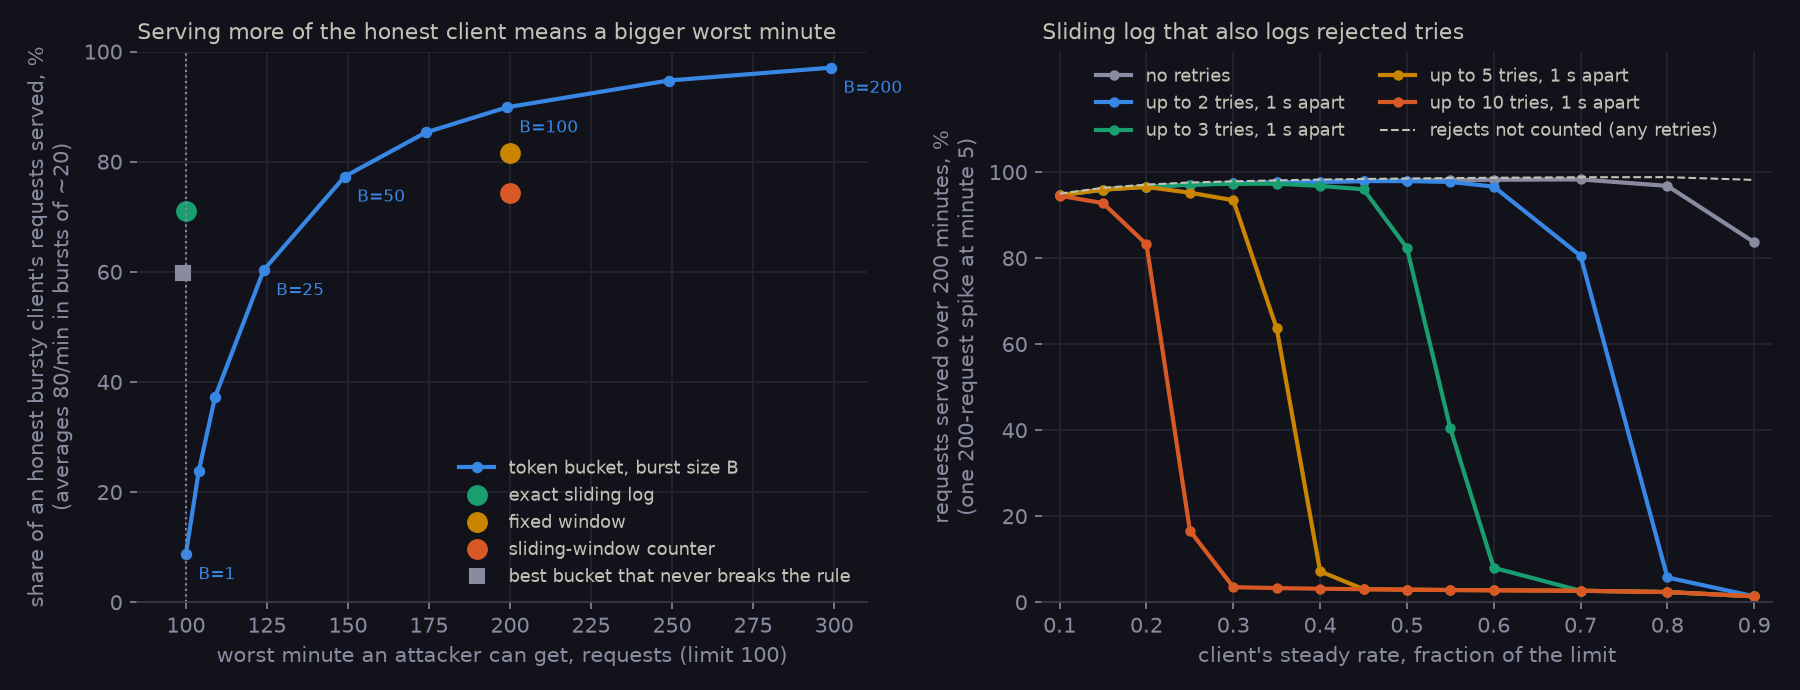
Left: page loads at 80% of the limit, attacker's worst minute from the flood test. Right: steady client, 20 runs per point.
The sliding-window counter
The counter sits between the fixed window and the log in the table, which looks like a sensible compromise until you set it next to a token bucket. Its worst minute is 200. A token bucket with B = 75 has a worst minute of 174 and served at least as much in 19 of the 20 combinations of traffic shape and load, and the 20th was within 0.1 point (74.1% against 74.2%). With B = 50 the worst minute is 149, and it served at least as much in 14 of the 20 (it loses on the big bursts, and on page loads at 30% and 50%). In the left panel of the figure, the counter and the fixed window both sit under the token bucket curve.
Where the counter does better is the typical overshoot under mild bursts: for small bursts at 80% its busiest real minute was 142, against 149 for B = 50 and 174 for B = 75. If what you care about is how far ordinary traffic drifts over, rather than what an attacker can get, that's a real advantage.
Cloudflare measured the counter on 400 million requests from 270,000 sources and reported that 0.003% were wrongly allowed or rate-limited. That's a measurement of their traffic, most of which never gets near a limit, and far from the limit every method agrees. Near it, measured against its own history, my numbers are much larger. For a steady client at 80%, 0.06% of decisions were wrong rejects and 1.0% wrong admits. For page loads at 80%, 12.0% and 8.1%. The counter errs in both directions, because it can't tell whether last minute's requests came early or late.
Counting the rejects
A common way to build a sliding log in Redis is a sorted set per key: drop entries older than 60 seconds, add the new request, count, and reject if the count is over the limit. Done in that order, the rejected request stays in the set and counts against the client. For a fixed window that makes no difference (the counter is already at the limit and resets on schedule anyway; in my runs the results were identical). For a sliding window it changes everything once clients retry.
I gave a steady client a single spike of 200 requests at minute 5 and had it retry rejected requests once a second, up to m tries. If rejects count, a locked-out client's every try is logged, so the log holds about m times its normal traffic. If that stays well above 100, the window never empties and the client stays locked out:
| Tries per request | Never locked (of 20 runs) | Always locked (of 20 runs) |
|---|---|---|
| 1 (no retries) | up to 90% of the limit | never |
| 2 | up to 60% | from 80% |
| 3 | up to 45% | from 70% (19 at 60%) |
| 5 | up to 30% | from 45% (19 at 40%) |
| 10 | up to 20% | from 30% (17 at 25%) |
Where all 20 runs locked, the client got 1% to 6% of its requests served over the 200 minutes. The lockout point sits somewhat above "tries × rate = limit", at roughly 1.6 to 3 times it (higher with more retries), because a locked request's tries arrive in a clump and the window has to stay full at every moment to hold the lock. With rejects not counted, the same clients were served 95% to 99% at every rate and retry count. A sliding-window counter that counts rejects behaved the same way, locking slightly earlier.
The fix is one line: don't record a request you rejected. (If you want to punish clients that hammer a closed door, do it with a separate, explicit penalty, not as a side effect of the log.)
Splitting the limit across servers
Another common shortcut is to give each of K servers its own limit of 100 / K and route requests at random. With an exact log on each server, the steady client at 80% was served 99.6% on one server, 95.0% on 4, 87.9% on 10 and 80.2% on 20: random routing makes some servers' shares busier than others. For page loads the loss was smaller (71.0% to 67.7% on 10 servers), because the bursts were already doing most of the rejecting. Per-server token buckets with B = 100 / K lost less, from 100% to 99.6% on 10 servers.
What I'd take from it
- Decide which promise you're making. "At most 100 in any minute" protects a backend precisely and rejects a lot of honest bursty traffic; nothing can do better at that promise than a sliding log. If you serve more, you're promising something looser, so say what: "100 a minute with bursts of up to 50" is a token bucket, and its worst case is exactly B + 99.
- If you're going to break the literal rule anyway, a token bucket breaks it in a known, tunable way. The sliding-window counter allows 200 in the worst case and served no more than a token bucket whose worst case is 174 in 19 of 20 cases (the 20th within 0.1 point).
- Never record rejected requests in a sliding limiter. Combined with ordinary retries it turns one spike into a lockout for a client using a quarter of its quota.
- Publish the burst size along with the rate. A client can't stay under "100 a minute" in practice without knowing how bursty it's allowed to be.
Caveats: these are synthetic traffic shapes, one key at a time, and I modeled the splitting as random routing with no shared state. Real gateways that sync counts between servers trade a different error, admitting too much during the sync delay, which I didn't measure here. (I measured it later: Every Gateway Thought There Was Room.)