Hedge the Server, Not the Request
A hedged request is the simplest tail-latency trick there is: if a request hasn't come back by the time 95% of requests normally have, send a copy to another server and take whichever answer arrives first. Dean and Barroso's "The Tail at Scale" (2013) made it famous with a striking number: in a Google benchmark reading 1,000 keys from BigTable, hedging after 10 ms cut the 99.9th-percentile latency from 1,800 ms to 74 ms for only 2% more requests. The same paper describes tied requests: send the request to two servers at once, and whichever starts working on it first tells the other to drop its copy.
"Only 2% more requests" is the part I wanted to test. A hedge is extra load, and extra load is exactly what makes queues slow. So I simulated it across load levels and across three different reasons a request can be slow. The short answer: it depends almost entirely on where the slowness lives. If the server is slow (a stall, a GC pause, a noisy neighbor), a hedge is cheap and cuts the deep tail about 5×. If the request itself is big, the hedge is a second copy of the same big job, it costs far more than its share of requests suggests, and above about 80% load it makes things worse. A hedge delay tuned when things are quiet turns into a collapse at 90% load. Tied requests were the best option almost everywhere.
The setup
Ten servers, each a first-come-first-served queue, random (Poisson) arrivals. Time is measured in units of the average request's service time. A new request goes to the less busy of two random servers ("two choices"), and so does a hedge, never to the server already holding the request. When the first copy finishes, the other is cancelled at once, whether it's still waiting or already running. Each point is 4 runs of a million requests (the first 100,000 discarded), and "load" means load from the requests alone, before any copies.
Three worlds, differing only in why a request is slow:
- noise: every attempt takes an independent, exponentially distributed time, so a copy gets a fresh roll of the dice. This is the world hedging is designed for.
- stalls: request sizes are exponential and a copy has the same size, but each server stalls 2% of the time, for stretches averaging 50 service times, during which it runs at 1/20 speed.
- big jobs: no stalls, but request sizes are very uneven (a two-phase mix with squared coefficient of variation 10: most requests small, a few dozens of times bigger). A copy is the same big job.
Strategies: no hedging; hedging after a fixed delay equal to the 95th percentile of unhedged latency measured at the same load; the same, but with the 95th percentile measured at 10% load and then left alone (what happens when someone tunes it once on a quiet day); hedging after a live 95th percentile of the last 2,000 responses; the quiet-day delay plus a token bucket allowing hedges on at most 5% of requests (burst of 10); and tied requests.
Checks before trusting it. With random routing and no hedging, each server is a textbook M/M/1 queue: at 90% load the mean latency came out 10.07 ± 0.05 against 10, the p99 47.1 ± 0.6 against 46.1, and at 30% load the mean was 1.431 against 1.429. At near-zero load, hedging after 1 time unit in the noise world has a closed form: p99 2.796 against 2.803, with 36.83% of requests hedged against e−1 = 36.79%. And two-choice routing on 1,000 servers matches the mean-field formula: mean latency 2.618 ± 0.005 against 2.614 at 90% load, 1.265 against 1.266 at 50%.
One bug caught on the way: in my first version of tied requests, when both chosen servers were idle, the second copy started before the first copy's cancellation could reach it, so at low load both ran to the end. Tied requests looked great and did up to 73% extra work. Everything below is from the fixed code.
The results
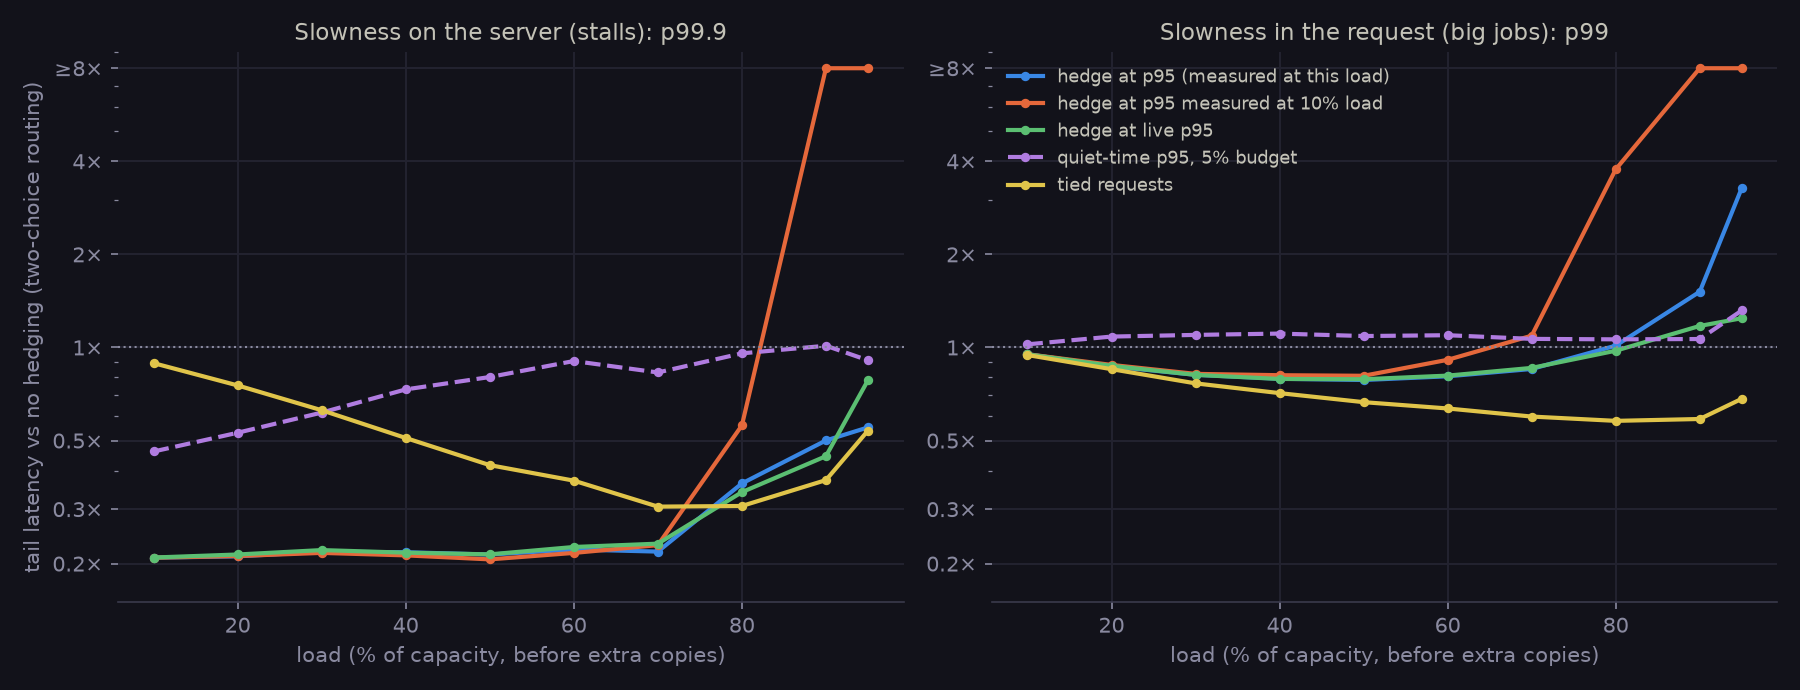
Each line is tail latency divided by tail latency with no hedging, at the same load, with two-choice routing. Below the dotted line is better. 4 runs of 900,000 measured requests per point.
| Load | No hedge | Hedge at p95 | Extra work | Tied |
|---|---|---|---|---|
| stalls, p99.9 | ||||
| 10% | 35.7 | 0.21× | 4% | 0.89× |
| 50% | 40.6 | 0.21× | 4% | 0.42× |
| 70% | 49.5 | 0.22× | 3% | 0.31× |
| 90% | 68.5 | 0.50× | 1% | 0.37× |
| big jobs, p99 | ||||
| 10% | 17.6 | 0.95× | 39% | 0.95× |
| 50% | 30.1 | 0.78× | 17% | 0.67× |
| 70% | 39.2 | 0.85× | 10% | 0.60× |
| 90% | 59.2 | 1.51× | 4% | 0.59× |
| noise, p99 | ||||
| 10% | 4.7 | 0.83× | 0% | 0.99× |
| 50% | 5.7 | 0.83× | 0% | 0.87× |
| 90% | 10.5 | 0.93× | 0% | 0.74× |
"No hedge" in service times; the other columns relative to it. Hedge at p95: delay is the unhedged 95th percentile at that load. Extra work: server time spent beyond one copy per request. Tied requests with instant cancellation do no extra work.
Stalls: cheap and large
When the slowness is a stalled server, a copy elsewhere doesn't inherit it. Hedging at p95 cut the 99.9th percentile to about a fifth (35.7 to about 7.5 service times at 10% load) all the way up to 70% load, while hedging 5-6% of requests and doing 3-4% more work. The work is small because the copy is a normal-sized request on a healthy server, and the stalled original gets cancelled.
The surprise was how much of the textbook win is really load balancing. With purely random routing, hedging looks even better: 0.07-0.09× at the 99.9th percentile up to 50% load. But random routing without hedging is also 2.7× (at 10% load) to 4.7× (at 90%) worse at p99.9 than two choices. Two choices already steers new work away from a stalled server, because its queue grows. At the 99th percentile that is nearly all of it: on top of two choices, hedging bought only 4-14% up to 70% load, and made p99 17% and 32% worse at 80% and 90%. What two choices can't fix is the request already being served when the stall begins. That request is the 99.9th percentile, and that's what the hedge rescues.
It depends on the stall being longer than the hedge delay. With the live-p95 hedge at 30% and 70% load, stalls averaging 2 service times gave 0.87×, 5 gave 0.59-0.65×, 20 gave 0.30-0.35×, 50 gave 0.22-0.23×, and 200 or more gave 0.12-0.19×.
Big jobs: the hedge is the same big job
When the slowness is in the request, the requests that cross the hedge delay are the big ones, and a copy is just as big. At 10% load, hedging 6.3% of requests added 39% to the servers' work. The gain was small (0.78-0.82× at 30-50% load, from copies that skip a long queue), and from about 80% load on the extra work cost more than it saved: 1.01× at 80%, 1.51× at 90%, 3.3× at 95%. At 95% the delay, measured without hedging, was crossed by 49% of requests, because the hedges themselves pushed latency up and more requests crossed the delay. That's a feedback loop, and hedging is supposed to fire on the slowest 5%.
The noise world is the opposite extreme: there a hedge costs nothing at all. With exponential times the remaining time of a running request is just as random as a fresh one, so racing two copies and cancelling the loser does exactly the same work on average (0.998 of one copy in the zero-load check). Aggressive hedging can't hurt there. It's the best case, and it's the one the intuition comes from.
The delay tuned on a quiet day
A fixed delay set from the 95th percentile at 10% load did as well as anything at low load and then fell off a cliff. Under stalls it hedged 22% of requests at 70% load, 50% at 80% (p99.9 0.56×), and every request at 90%, where the copies' extra 15% of work pushed the servers past capacity: the 99.9th percentile went to 81× worse, with queues growing until the run ended. With big jobs it was 1.09× at 70%, 3.8× at 80% and 189× at 90%.
The live delay avoided that, because it rises with load and keeps the hedge rate near 5-10%. It matched the fixed per-load delay where hedging helps and limited the damage where it doesn't: with big jobs, 1.17× at 90% and 1.24× at 95% instead of 1.51× and 3.3×.
Budgets: right idea, easy to size wrong
A token bucket that caps hedges at 5% of requests did prevent the collapse: the quiet-day delay with a 5% budget stayed at or under 1.01× at 90% load in the stall world. But it gave away most of the benefit: 0.46× at 10% load and 0.80× at 50%, against 0.21× without it. A p95 delay means about 5% of requests want a hedge on an ordinary day, so a 5% budget is empty most of the time, and stalls make the demand bursty: a stalled server holds several requests that all want a hedge at once. A 15% budget kept the full benefit up to 50% load (0.21-0.23×) and was still harmless at 90% (0.98×). A budget should be a multiple of the hedge rate you expect, not equal to it.
Tied requests
Tied requests send to two servers, and the first to start tells the other to drop its copy, so with instant cancellation they never do extra work. In the big-jobs world they were the best strategy, or tied for best, at every load: 0.77× at 30%, 0.58-0.60× from 70% to 90%, 0.68× at 95%. Under stalls they were weaker than hedging at low load (0.89× at 10%: with two idle servers the request just starts on one of them, and if that one stalls there is no backup), but better from 80% up (0.31× at 80%, 0.37× at 90%). In a mixed world with both big jobs and stalls, tied requests gave 0.46-0.61× at the 99.9th percentile from 50% to 90% load, against 0.64-0.95× for the live-delay hedge, which also spent 4-14% extra work.
The catch is the cancellation. If it takes 0.1 service times to arrive, both copies sometimes start, and at 95% load in the stall world that duplicated work tipped the system over: p99 22× worse. Tied requests need servers that can tell each other quickly to drop work, which is a much bigger ask than a client-side timer.
What I'd take from it
- Hedge when the slowness is the server's fault: pauses, stalls, a bad host. Measure how much extra work hedges cause, not how many extra requests; with big requests the two differ by 6× (6% of requests, 39% of work).
- Fix the routing first. Two choices did most of what hedging did at the 99th percentile; hedging's own contribution is the 99.9th.
- Never use a hedge delay measured at a different load. Use a live percentile, and add a budget several times the expected hedge rate as a backstop.
- If the servers can cancel each other's work quickly, tied requests beat hedging at high load in every world here.
Caveats: ten servers, first-come-first-served queues, no network delay, instant and free cancellation (except in the delayed-tie test), and no fan-out. Dean and Barroso's 1,000-key benchmark is a fan-out, where one slow key holds up the whole read, so its 99.9th percentile is much more exposed to stalls than a single request is. The stall model is mine: 2% of the time at 1/20 speed. Shorter stalls give hedging less to rescue, as the stall-length numbers show.