Close in Rank, Far in Milliseconds
Nobody stores every request latency to compute a p99. Monitoring systems keep a sketch: a small summary that can answer "what's the 99th percentile?" approximately, and that can be merged across servers and time windows. There are several families, and they promise different things. KLL promises the answer's rank is close: ask for p99 and you get the value at some rank near 99%, within a stated error such as ±1.3%. DDSketch promises the answer's value is close: within 1% of the true p99. t-digest promises nothing formal but is built to be good at the tails. And most dashboards use none of them, just a fixed set of histogram buckets.
I wanted to know what those promises are worth in milliseconds, so I fed the same streams to all of them and measured. The short version: a rank guarantee is the wrong currency for latency. At about 2.5 KB, KLL's p99 was off by up to 19% to 44% depending on the data, and its p99.9 by up to several times. DDSketch at 1% stayed within 1% at every quantile on every dataset, in a third of the space or less. The reason is that real latency curves have cliffs, and on my real data the cliff sat right at p99.
The setup
Four datasets of a million latencies each, in milliseconds:
- HTTP: real measurements. A small Node HTTP server doing a bit of JSON work per request, with every 200th request taking a slow path, and a client keeping 16 requests in flight. I recorded 4 million latencies and each run takes a random million-long window.
- Lognormal: median 20 ms, σ = 1.
- Bimodal: 98.5% of requests around 5 ms, 1.5% around 200 ms, like cache misses going to a slow backend.
- Pareto: shape 1.5, a heavy tail.
The sketches: KLL, REQ (a newer rank sketch that can be set to be most accurate at high ranks) and t-digest, all from Apache DataSketches 5.2; DDSketch, my own few lines, which return exactly the same quantiles as Datadog's Python library on a test stream; and a Prometheus-style histogram with buckets at 1, 2.5 and 5 per decade from 0.01 ms to 50 s, read with Prometheus's interpolation rule. Sizes are serialized bytes for the DataSketches ones, a compact count-per-bucket encoding for DDSketch, and 8 bytes per bucket for the histogram. Each configuration ran on 100 different streams per dataset, and I report the 95th-percentile error across those runs: the bad-but-not-unlucky case.
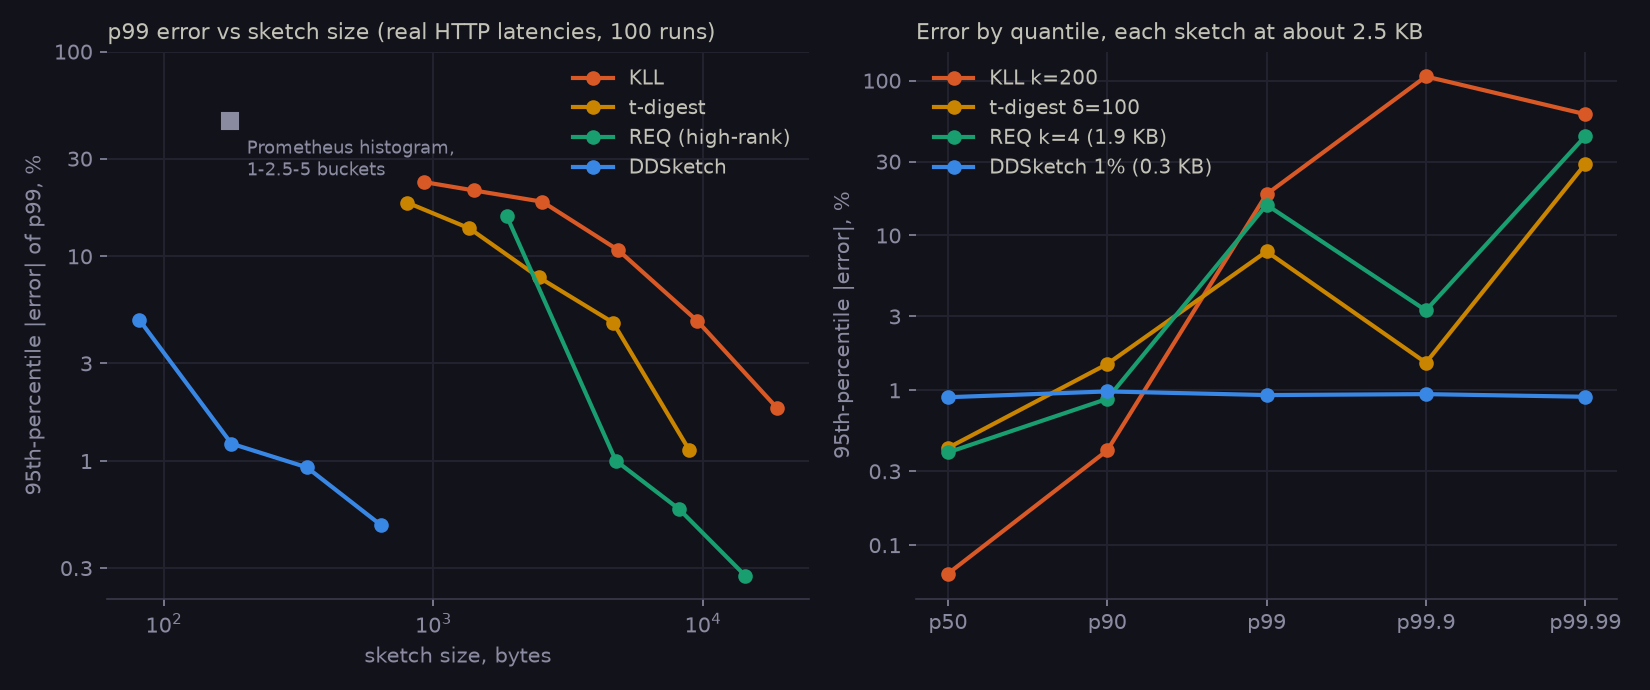
Real HTTP latencies, streams in random order, 100 runs per point. The error is the 95th percentile of |estimate − true| ÷ true across runs.
Every sketch kept its promise
KLL did exactly what it says. With k = 200 (2.5 KB) the library advertises a rank error of 1.3%; the measured 95th-percentile rank error was 0.2% to 0.6% at every quantile on every dataset. The problem is what 0.5% of rank means at the tail. Above p99 there's only 1% of the data, and above p99.9 only 0.1%, so a 0.5% rank error at p99.9 means the sketch can't tell p99.4 from the maximum. On the Pareto data, in the worst 5% of runs its p99.9 was 4.8 times the true value or more at k = 200, and 7.6 times at k = 800 (9.5 KB): four times the memory didn't help, because a 0.2% rank error is still bigger than the 0.1% of data above p99.9.
DDSketch did what it says too: every estimate within 1%, on every dataset, in every order, in every run. It's a histogram whose bucket edges grow by 2% each, so any value lands in a bucket whose midpoint is within 1% of it. It's small because latencies only span a few orders of magnitude: 180 buckets for the HTTP data, 440 for the lognormal.
| p95 |error| at p99 / p99.9, % | HTTP | lognormal | bimodal | Pareto |
|---|---|---|---|---|
| KLL k=200 (2.5 KB) | 19 / 106 | 27 / 77 | 35 / 35 | 44 / 385 |
| t-digest δ=100 (2.5 KB) | 7.9 / 1.5 | 5.5 / 5.1 | 9.7 / 2.5 | 9.3 / 12 |
| REQ k=6 (4.7 KB) | 1.0 / 0.3 | 1.3 / 1.1 | 2.1 / 0.5 | 2.8 / 2.2 |
| DDSketch 1% (0.3–0.8 KB) | 0.9 / 0.9 | 1.0 / 0.9 | 0.9 / 0.8 | 0.9 / 1.0 |
| histogram, 1-2.5-5 buckets (176 B) | 46 / 28 | 16 / 11 | 7.5 / 37 | 11 / 6.4 |
Streams in random order, one sketch per stream, 100 runs per cell.
t-digest landed in between: 5% to 10% at p99 at 2.5 KB, better further out, and worse in the middle (12% at the median on the lognormal data, where it deliberately spends little memory). REQ in high-rank mode is the rank sketch done right for tails: its rank error shrinks toward the top, so at equal size it was the most accurate of the rank-based ones. It also needed nearly twice the memory to get there; at its smallest setting (1.9 KB) it was 16% at p99 on the HTTP data.
Why p99 was harder than p99.9
On the HTTP data, t-digest and REQ both did worse at p99 than at p99.9, and KLL's p99 was off by up to 19%. The data explains it. The 98.5th percentile is 0.263 ms and the 99th is 0.324 ms: a 23% jump in half a percent of rank. The slow path accounts for half a percent of requests by itself, and requests delayed behind a slow one plausibly make up the rest: about 1% of requests sit past a cliff. Ask a rank sketch for p99 with a rank error of a few tenths of a percent and it can return a value from either side of that cliff. The bimodal dataset is the same thing on purpose, and KLL's p99 there was off by up to 35%.
I don't think the cliff sitting at p99 is a coincidence. Latency curves get their shape from discrete things that happen to a small fraction of requests: a cache miss, a garbage collection pause, a slow path, a retry. Those fractions are often around 1%, which is why people started looking at p99 in the first place. The tail percentiles are where the cliffs are, and a cliff turns a small rank error into a big value error.
Fixed buckets
The histogram with 3 buckets per decade was off by 7% to 46% at p99, which is about what a bucket that wide allows: Prometheus interpolates linearly inside the bucket, so it's guessing where in, say, 0.25 to 0.5 ms the answer falls. On the HTTP data, Prometheus's default buckets (5 ms up to 10 s) were far worse: the whole distribution fits in the first bucket, so every quantile is a fraction of 5 ms and the p99 came out 15 times too high. Fixed buckets are only as good as how well someone chose them for this service. The newer exponential "native" histograms in Prometheus are the same idea as DDSketch, with buckets that grow by a constant ratio.
Merging and order
Splitting each stream into 100 pieces, sketching each and merging the sketches didn't hurt much. On the HTTP data, KLL's p99 error went from 19% to 17%, t-digest's from 7.9% to 9.1%, REQ's from 1.0% to 0.6%; the biggest increase anywhere was t-digest on the bimodal data, 9.7% to 12%. DDSketch and the histogram merge exactly, so merging can't change them at all. Feeding the data sorted didn't break anything either. Ascending order helped KLL a lot (p99.9 error 1.3% instead of 77% on the lognormal data), I think because the largest values then arrive last and are still held at full detail when the stream ends. Descending order was somewhat better than random order for KLL, nowhere near ascending.
Averaging p99s
Without a mergeable sketch, the usual move is to average per-host p99s. I tested that too: 100 hosts, 10,000 requests each, and compared the mean, median and maximum of the hosts' exact p99s with the true p99 of all requests together. When the hosts are alike it's harmless: the mean was within 1% on the synthetic data and 4% low on the time-ordered HTTP data. It breaks when they differ, which is exactly when you're looking:
| slow hosts (5× slower) | mean of p99s | median of p99s | max of p99s |
|---|---|---|---|
| none | −0.1% | −0.2% | +7.8% |
| 1 of 100 | −7.1% | −11% | +345% |
| 5 of 100 | −28% | −40% | +210% |
| 10 of 100 | −37% | −55% | +137% |
Lognormal latencies, σ = 0.8; 200 runs per row. Error relative to the p99 of all requests together.
With 5 of 100 hosts slow, those hosts carry 5% of the traffic, so the true p99 is somewhere inside the slow hosts' distribution. The average of p99s mostly reflects the 95 fine hosts and reads 28% low; the maximum reads the worst host's own p99 and is 3 times too high.
What I'd use
- For latency, use a sketch with a relative-error guarantee: DDSketch, HdrHistogram, or exponential native histograms. In this test it was the most accurate, and smaller than everything except the fixed buckets.
- Don't read a rank-error bound as a latency error bound. "1% rank error" can mean tens of percent at p99 and several times at p99.9, and the error is worst exactly where the distribution has a cliff.
- If you need a rank sketch (DDSketch needs positive values, and its size grows with the range of values), use one that's tuned for tails, like REQ in high-rank mode, or a t-digest with generous memory.
- Merge sketches, don't average percentiles. Averaging looked fine on identical hosts and was 28% low with 5% of hosts slow.
- If you're stuck with fixed buckets, put several inside the range you care about. Defaults built for a 100 ms service told me a 0.3 ms service had a 5 ms p99.
Limits: one real workload from one machine, and three synthetic ones. Streams were a million values; sketches like KLL and t-digest change little with stream length, but I didn't test that. DDSketch's flat 1% depends on the values staying within a few orders of magnitude and away from zero, which latency does. Sizes are serialized sizes; in-memory sizes are larger for all of them.