The Cliff Was a Trap Door
The Least Loaded Server Is a Rumor left a loose end. Several dispatchers share a load board that's refreshed every T service times, and each one adds the jobs it sent since the last refresh to what the board says. With three or more dispatchers that setup herds badly, and the herd gets worse as the board gets staler. Then, past some staleness, response time falls off a cliff to near round robin. I measured where the cliff sits (the peak times (1 − load)² came out constant) and said I didn't have an explanation I'd trust.
I have one now, and the cliff turns out to be the wrong picture. Past the cliff the herd hasn't gone away. The system has two stable states, and which one you get depends on its history.
Same settings, two outcomes
Setup as before: 100 identical servers with first-come-first-served queues, jobs arriving at random, mean job size one service time, each job handed to one of k dispatchers at random. Each dispatcher sends the job to the server with the lowest board count plus its own sends since the refresh. The only new thing is how the run starts: either every queue at the same length, or half the servers with a backlog and half empty, roughly what you'd see right after adding a batch of fresh servers or after half the fleet restarts.
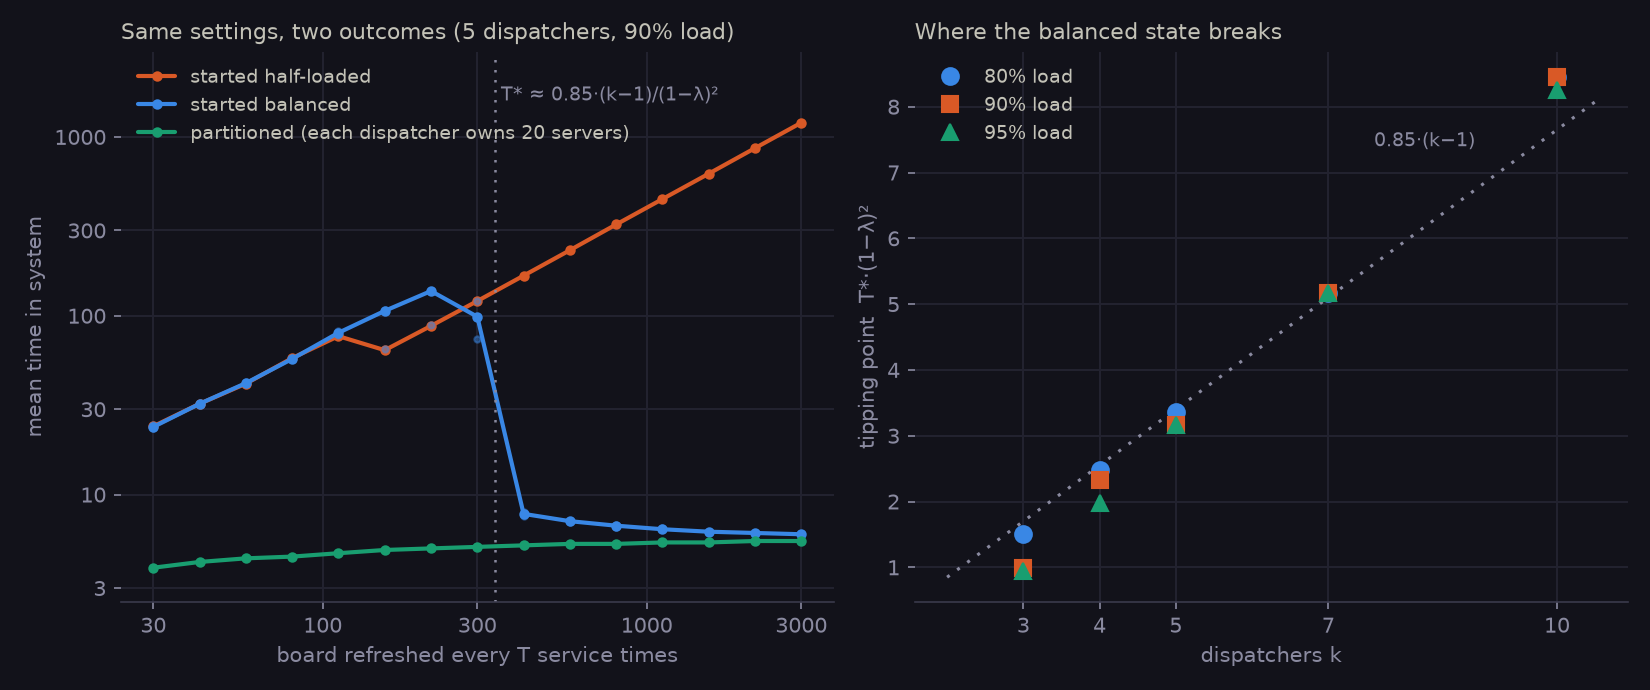
Started balanced, five dispatchers at 90% load reproduce the old cliff: herded up to a refresh period of about 300 service times, then down to 6 to 8 and staying there. Started half-loaded, the herd never lets go. At T = 1,100 the mean time in the system is 449 against 6.4 from a balanced start; at 3,000 it's 1,200 against 6.0. Same servers, same load, same dispatchers, a 200-fold difference.
It doesn't take much of a push. A half-loaded start with a backlog of 0.1T jobs per loaded server tipped every run I tried, at every refresh period from 450 to 2,000; 0.05T recovered. A single server with 3,200 extra jobs didn't tip anything: all the dispatchers avoid it, but the slack is spread over 99 others and gets absorbed. The trigger is a broad imbalance, not one bad server.
Why the balanced state breaks where it does
Take the balanced state and look at one refresh. The board shows small random differences between servers, and every dispatcher sees the same ones. Each dispatcher, keeping its own tally, tops up the servers that look short until they look even, then spreads its jobs evenly. But there are k of them doing the same top-up, so a server that looked short by d receives kd extra and ends up (k − 1)d ahead. Every refresh, the board's differences come back inverted and multiplied by k − 1.
What pulls the system back is draining. Once the top-up is over, every server receives jobs at the load rate λ and serves at rate 1, so a server that's ahead loses its excess at 1 − λ per service time while the others sit near their usual short queues. If that drain clears the overshoot before the next refresh, the next board shows only the usual noise and the balanced state survives. If not, the next board shows the overshoot, it gets multiplied again, and the system tips.
So the balanced state needs (k − 1) × (typical spread) to be smaller than (1 − λ) × T, up to a constant. I measured the spread directly: the gap between the longest and shortest queue on the board times (1 − λ) came out at 2.1 to 2.8 across loads of 70 to 95% and two to five dispatchers, so the spread grows like 1/(1 − λ). Put together, the tipping point should scale like (k − 1)/(1 − λ)². That's where the (1 − load)² came from. In the first post I guessed it was the time a single queue takes to forget its starting point; that guess was wrong.
The right panel checks the prediction. For four to ten dispatchers, the tipping point times (1 − λ)² sits close to 0.85 × (k − 1) at 80, 90 and 95% load. At 90 and 95% load, three dispatchers tip earlier than the line (about 1.0 instead of 1.7); with an overshoot factor of only 2, the simple drain argument is at its weakest there. The constant 0.85 is fitted, not derived (the update at the end derives the edge from a model and corrects the line). Well below the threshold the balanced state lasts a handful of refreshes; above it, not one of 10 runs tipped in 1,000 refreshes. It's a sharp edge, not a slow leak.
Why the herd never ends
The herd is the same multiplication running at full size. Half the servers look short, every dispatcher piles onto them, and by the next refresh the other half look short. The swing in each period is set by how many jobs each dispatcher sends per period, which grows with T, and so does the backlog the drain would have to clear. Everything scales with T together, so the drain never catches up, however stale the board gets. Started half-loaded, the mean time in the system came out at 0.40T at every refresh period from 300 to 3,000. A start with queue lengths spread evenly from short to long settled in a different herd at about 0.6T, so there's more than one herded pattern.
That changes what the first post's cliff means. Past it, the herd isn't fixed. You're standing on a trap door that a large enough disturbance opens, and nothing in the system closes it again.
What gets you out
Best of two doesn't. With each dispatcher sampling two servers and adding its own tally, the same trap is there: at T = 2,000 a balanced start averaged 6.9 and a half-loaded start 334. Without the tally, best of two simply sits in the herd at long refresh periods (343 from either start). The tally is what creates the good state; it doesn't remove the bad one.
What works is making each dispatcher's tally complete. If each of the five dispatchers owns its own 20 servers and only sends there, its tally sees every job those servers get, and there's no one else's top-up to multiply. Partitioned that way, the mean time in the system stayed between 3.9 and 5.5 at every refresh period from 30 to 3,000, from either start, about what a single dispatcher with a tally gets (round robin is 5.2 here). Sharing the tallies, so every dispatcher counts everyone's sends, should do the same; one dispatcher is that case, and it recovered from every start I tried.
- Several dispatchers, each correcting a shared stale view with only its own sends, overcorrect together. With k of them, each refresh multiplies the imbalance by k − 1.
- The balanced state survives only if queues drain that overshoot between refreshes: roughly T > 0.9(k − 2)/(1 − λ)² with many servers (see the update; I first fitted 0.85(k − 1) on 100 servers). At 90% load and five dispatchers that's about 290 service times.
- Past that point the herd still exists. A fleet-wide imbalance (a restart, a scale-out) can flip the system into it permanently, at 200 times the response time.
- Partition the servers among the dispatchers, or share the tally. Either removes the multiplication.
Limits: one simulator, exponential job sizes, 100 servers, identical dispatchers that each get a random share of the jobs. I haven't tested whether real systems refresh their load views slowly enough to sit near this edge. The point that I'd carry over is that a cliff in a parameter sweep can hide two coexisting states, and a sweep that always starts from the same place can't tell you which one is the cliff.
Update: deriving the edge
Added 2026-10-08. I called the 0.85 fitted, not derived. Here's a model that produces the edge with nothing fitted. Let the number of servers go to infinity, so the board is no longer a list of queue lengths but a distribution of them. One refresh period then turns one distribution into the next. Each dispatcher's tally raises its water level one job at a time. While the level is at v, every server whose board reads v or less gets one job from each dispatcher, at a random point in that dispatcher's pass, and the pass takes kF(v)/λ, where F(v) is the share of servers at or below v. Once the level clears the top of the board, everyone gets jobs at rate λ. Servers finish jobs at rate 1. The balanced state is a fixed point of that map.
The model matches the simulator where both can be checked. The average queue on the board at each refresh comes out within 1% of a 1,600-server simulation: 4.73 against 4.73 for one dispatcher at T = 600, 5.49 against 5.50 for five dispatchers at T = 400, 15.9 against 15.9 for five at T = 20, which is already herded. Following the balanced fixed point down from long refresh periods, it holds to a certain T, and just below that the map runs off from it into the herd. That's the edge:
| Dispatchers | Model, 80% load | Model, 90% load | Simulator, 90% load, 800 servers |
|---|---|---|---|
| 3 | 0.87 | 0.99 | 0.95–1.05 |
| 4 | 2.11 | 1.97 | |
| 5 | 3.17 | 2.90 | 2.9–3.0 |
| 7 | 5.02 | 4.63 | |
| 10 | 7.96 | 7.07 | 7.2–7.5 |
The numbers are T(1 − λ)² at the edge. The simulator column brackets the edge between the last refresh period where all four to six runs tipped and the first where at most one did.
Three things change. First, the line isn't 0.85(k − 1). At 90% load the model's edge goes up by about 0.85 per extra dispatcher, but it starts from about two dispatchers, not one: 0.9(k − 2) is within 10% of every 90%-load value above, model or simulator (at 80% load the model sits up to 15% above it). That's why three dispatchers looked low; it wasn't the drain argument breaking down. The model puts three dispatchers at 0.99 at 90% load and 0.96 at 95%, where the simulator had them. It also predicts that two dispatchers never tip, and they don't: with two, the simulator recovered from a half-loaded start with a backlog of 0.2T at every refresh period from 5 to 300. Each refresh flips the imbalance but doesn't grow it.
Second, the simulator's 100 servers put the edge about 10% high. At 90% load and five dispatchers, measured on a finer grid, the edge falls from about 3.5 with 25 servers to 3.2 with 100 and between 2.9 and 3.0 with 800 and 1,600. The model, with infinitely many, says 2.90. The (1 − λ)² scaling holds to within about 13% between 80 and 90% load.
Third, the 80% load, three-dispatcher point in the chart is wrong. My tipping test counted a run as tipped once the dispatchers stopped reaching every server for ten refreshes in a row. At 80% load with refresh periods this short, that happens with no herd at all: the mean time in the system stays between 3.5 and 5.6 for refresh periods from 20 to 45 with 100 or 800 servers, falling as the period grows. There's no sharp edge there to measure.