Straight Line, Wrong Slope
The sandpile is the textbook example of a power law. Take a square grid and drop grains of sand on random squares, one at a time. When a square holds four grains it topples: it gives one grain to each of its four neighbours, which may make them topple too. Grains that fall off the edge are gone. That's the whole model, from Bak, Tang and Wiesenfeld in 1987.
Most grains do nothing. Some set off a few topplings. Once in a while one sets off an avalanche across half the grid. Plot how often each avalanche size happens on log-log axes and you get something close to a straight line, which is what a power law looks like. Nobody tunes anything to get there, and that was the exciting part: the pile finds its own critical state. It became the standard story for why earthquakes, forest fires and stock crashes might come in power laws too.
I wanted to see the straight line for myself, and then check whether it holds up when the grid gets bigger. It's straight on every grid. But it isn't one power law, and the reason why is a nice little piece of physics.
Size here means the number of topplings. A square can topple more than once in the same avalanche, so it's not the same as the area covered. That difference turns out to be the whole story. (The random sandpile button is a variant I'll get to below.)
First, is the simulator right?
There's a neat exact answer to check against. Each grain does a random walk: every toppling moves one grain one square, and the four grains a toppling sends out are interchangeable. So the average avalanche size is the average number of steps a random walk takes to get off the grid, divided by four. That's a linear equation you can solve exactly for any grid.
| Grid | Exact average | Simulated | Off by |
|---|---|---|---|
| 64×64 | 153.0 | 153.1 | +0.06% |
| 128×128 | 593.9 | 594.1 | +0.04% |
| 256×256 | 2,339.3 | 2,339.0 | −0.01% |
| 512×512 | 9,284.9 | 9,284.6 | 0.00% |
| 1024×1024 | 36,995.5 | 36,993.4 | −0.01% |
Within a tenth of a percent at every size, about what a million random drops should give. The pile's average works. Now the shape.
A straight line with a moving slope
I ran grids from 64×64 up to 1024×1024, a million grains on each (200,000 on the biggest), after letting each pile settle into its steady state. On every grid the histogram is a straight line over a wide middle range, then it falls off at the size where avalanches start hitting the edges. That's expected. A power law with a cutoff set by the grid is the normal picture.
The problem is the slope of the straight part. If the pile really follows one power law, the slope is a property of the rules, and a bigger grid should just extend the line further before it drops. Instead:
| Grid | Sandpile slope | Random sandpile slope |
|---|---|---|
| 64×64 | 1.05 | 1.20 |
| 128×128 | 1.07 | 1.22 |
| 256×256 | 1.10 | 1.24 |
| 512×512 | 1.12 | 1.25 |
| 1024×1024 | 1.13 | – |
Slope of a straight-line fit to the log-log histogram, for sizes from 10 up to a thirtieth of the grid's area, written as a positive number. Avalanches of size zero are left out.
The slope steepens every time the grid doubles. So any single number I quoted for "the" exponent would partly be a statement about the grid size I happened to pick.
That alone doesn't damn the sandpile, though. For comparison I ran a close cousin, the random sandpile (the Manna model): a square topples at two grains instead of four, and throws both grains to neighbours picked at random. Its slope drifts too, by a bit less. Some drift is normal. Just before the cutoff, the histogram has a small bump, and the bump moves outward as the grid grows, so a straight-line fit gets dragged around by it. Fitting a slope by eye or by least squares is a bad way to measure an exponent. There's a better test.
Can the curves be made to line up?
A power law with a size cutoff has a precise meaning: the histograms from every grid should be the same curve, stretched. If P(size) = size−τ × f(size ÷ gridD), then multiplying each histogram by sizeτ and dividing each size by gridD should land all of them on top of each other. Two numbers, τ and D, and every grid collapses onto one curve. Try it:
Up: log₁₀ (share × sizeτ). Sizes below 10 are left out; they're dominated by the grid's squareness.
Best fits as a table
| Data | τ | D | Gap left | Seed-to-seed gap |
|---|---|---|---|---|
| Sandpile, size | 1.19 | 2.57 | 0.055 | 0.010 |
| Sandpile, area | 1.18 | 2.02 | 0.020 | 0.005 |
| Random sandpile, size | 1.28 | 2.76 | 0.016 | 0.011 |
| Random sandpile, area | 1.33 | 2.02 | 0.019 | 0.004 |
For the random sandpile, it works. The best fit is τ = 1.28 and D = 2.76, close to published estimates for this model (around 1.28 and 2.75), and the rescaled curves sit on top of each other. The gap left over is 0.016 on a log scale, not far above the 0.011 you get just from comparing two runs on the same grid.
For the original sandpile, no pair of numbers works. The best is τ = 1.19 and D = 2.57, and it still leaves a gap of 0.055, about 3 times the random sandpile's. Look at the hump before the cutoff: line up the straight parts and the humps come out at different heights; line up the humps and the straight parts fan out.
Now switch to area, the number of different squares an avalanche touched. Same pile, same avalanches. That collapses fine, with D = 2.02: the biggest avalanches cover a fixed share of the grid, which is what you'd expect.
There's a second test that doesn't need any curve-matching. If one power law with one cutoff describes everything, then the average of sizeq grows with the grid in a way that pins down D the same for every q. Ask the average of size, size², or size³ and you should get the same D. Here's D measured that way, across all the grids from 128×128 up:
| D from… | size | size² | size³ |
|---|---|---|---|
| Random sandpile, size | 2.760 ± 0.007 | 2.758 ± 0.009 | 2.754 ± 0.012 |
| Sandpile, area | 2.025 ± 0.004 | 2.024 ± 0.004 | 2.023 ± 0.004 |
| Sandpile, size | 2.685 ± 0.024 | 2.780 ± 0.031 | 2.788 ± 0.033 |
Each D is how fast the next average grows with grid size, minus how fast the one before it grows, fitted across grids from 128×128 up (128–1024 for the sandpile, 128–512 for the random one). The ± is one standard deviation from resampling the avalanches. Area columns use area in place of size.
The random sandpile gives the same D whatever you ask, and so does the original sandpile's area. The original sandpile's size doesn't: the D from size² comes out 0.095 higher than the D from plain size, with an uncertainty of 0.016 on that difference (both from resampling), so about six standard errors. For the random sandpile the same difference is −0.003 ± 0.005. Size³ and size² don't separate clearly in my data; the biggest grid only got 200,000 grains, and the high averages are dominated by a handful of huge avalanches. But one mismatch is enough. A single power law with a single cutoff can't produce it.
Why: the middle topples again and again
Here's one big avalanche from each model on a 256×256 grid, coloured by how many times each square toppled. Brighter means more.
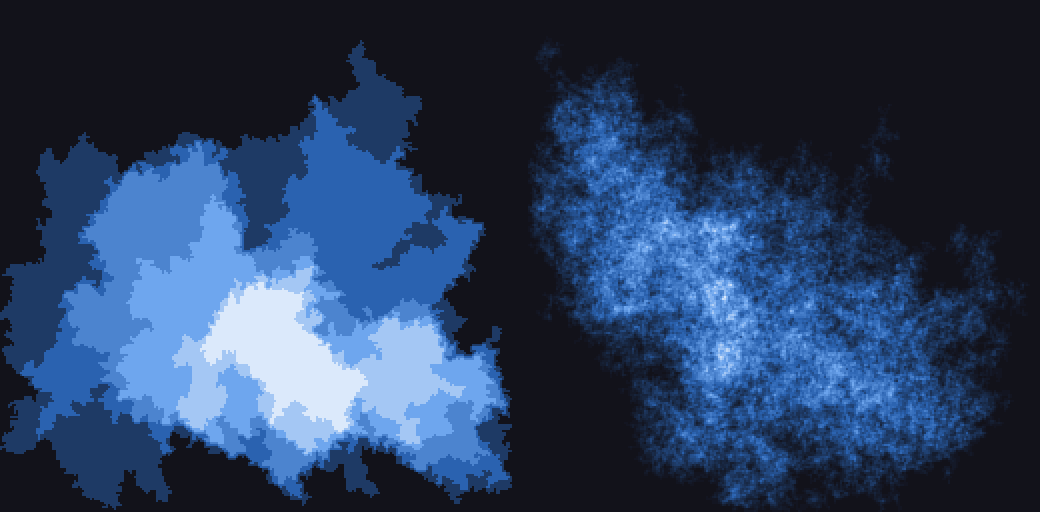
The sandpile's avalanche is a stack of terraces. That isn't a rendering choice; it's how the model works. An avalanche in the original sandpile happens in waves: the square where the grain landed topples, everything that becomes unstable topples once, and the wave dies out. Then, if the starting square has four grains again, it topples again and sends out the next wave. Within one wave no square topples twice. So the number of times a square topples is just the number of waves that reached it, and the picture is a set of nested regions.
Area counts each square once. Size counts it once per wave. On bigger grids the big avalanches have more waves stacked up:
| Grid | Waves | Topplings per square covered |
|---|---|---|
| 64×64 | 9 | 3.6 |
| 128×128 | 13 | 5.2 |
| 256×256 | 21 | 7.6 |
| 512×512 | 32 | 11.2 |
Averages over the biggest 0.1% of avalanches on each grid (a separate run of a million grains per grid, 400,000 on the biggest).
The random sandpile re-topples too, more in fact, but it's smooth: noise rather than terraces, and its sizes collapse fine. In the original, how many waves stack up, and how far each one reaches, depends on more than the avalanche's area. Tebaldi, De Menech and Stella worked this out in 1999: areas follow a clean power law, toppling counts don't follow any single one but a whole spectrum of them (multifractal), and large avalanches that run into the edge of the grid and lose grains there skew the statistics badly. Set those aside and the multifractal scaling shows up cleanly. I came in not knowing that and measured my way to the same split, which was a nice way to learn it.
What I take from it
A straight line on a log-log plot is weak evidence. Every grid I ran gave me one, for both models. The useful tests are whether different system sizes collapse onto one curve, and whether different averages agree on one D. The random sandpile passes both. The famous one passes both for area and fails both for the thing everyone plots, the number of topplings.
So "sandpile avalanches follow a power law" is true for one way of measuring an avalanche and not for another, and the slope you'd quote depends on the grid. That's worth knowing before reaching for the sandpile to explain earthquakes or market crashes, where nobody gets to choose the grid.
The simulator is one small file of plain JavaScript. Grains are dropped on uniformly random squares and the edges are open. Each pile was run for three grains per square before measuring, to forget its starting state, and I checked the average avalanche size against the exact answer above. The 1024×1024 grid got fewer grains than the others, so its numbers are noisier.